Roads are an ancient invention and are therefore deeply entrenched in our culture. One could even argue that without roads we wouldn’t have a culture, but perhaps that’s a story for another time.
Whether it’s literal or metaphorical, a road is a very intuitive image. It’s a clear symbol of progression, direction, and destination.
GetMyGraphics has a wide assortment of PowerPoint road graphics that can drive your point home with a small amount of tweaking and customization
Goal-setting
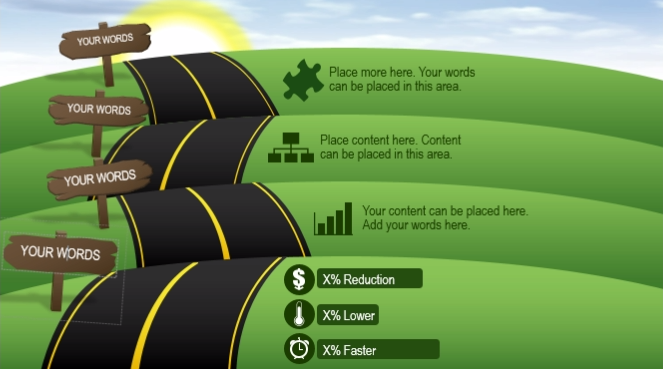
As always, you can change and manipulate each and every element of this graphic, from color, text, and all the way down to the individual shapes that make up each object you see. To use the graphic above, you might label each of the rolling hills as an obstacle or step on the way to the final destination and ultimate goal.
Inputs and Outputs
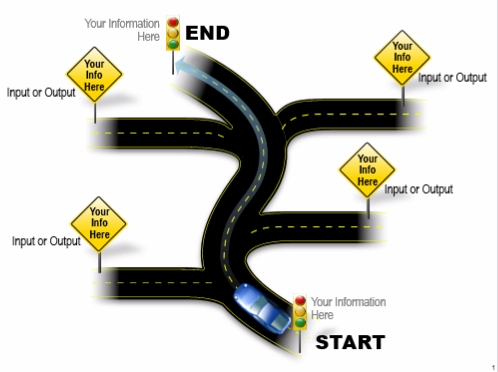
No system is isolated. Everything we do has consequences big and small in the real world, and outside forces influence our own processes. A graphic like the one above is handy for showing this. The blue car at the starting line can represent the beginning of a process. But there are also several adjoining streets that merge in and out of the street in question. Something will reach the end of the road, but other things will be added and subtracted along the way. Label each yellow sign to reflect what that contributing factor represents. You might also put other cars on the road, entering and exiting the main road to show input and output at different points in the process.
Distribution
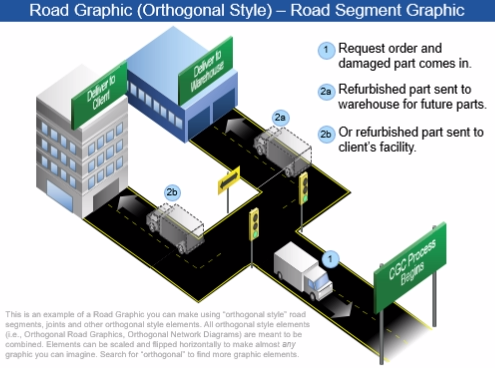
Every company has a product to distribute, whether it be a physical good or a service. Even if you deal with a completely computer-based product, you are distributing that product to your clients, though it may be virtually through the internet. The above graphic is a simplified distribution process that you can tailor to your needs. With a few tweaks you can probably make something that represents your business’s distribution model.
Flowcharts
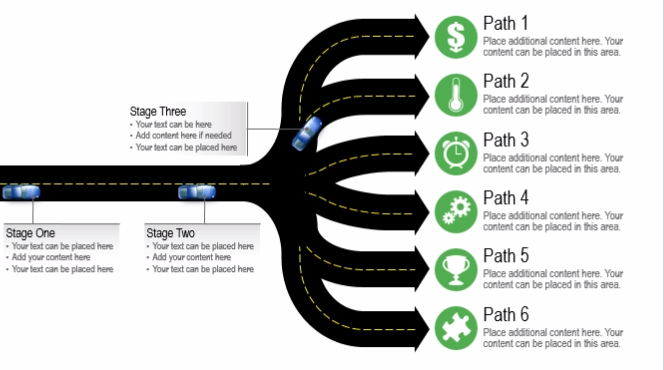
Many of our road graphics can be used as more visually interesting flowcharts. This one in particular presents a road that forks into 6 different paths one might take and each of their outcomes.
Sign up today to get these and many other PowerPoint graphics in our extensive graphic library. Ready. Get set. Go!
Recent Comments