A fair amount of the idioms in the English language involve chains and chain links, lending the imagery to a number of apt business comparisons. It makes sense, then, that you might wish to put chains, links, or even locks in your PowerPoint Presentations to help get those principles across! Well, do we have the missing link for that desire or what!?
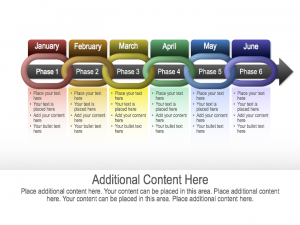
Chain graphics can represent a lot of things that go on in your business, from people to places to tasks. More often than not, they’re going to represent the vital processes and operations going on from day to day (or month to month, as in the graphic pictured above). Each link embodies the phases of a project, and you can fill in the details on what keeps that link strong. You can also show how certain links may be weaker and how to avoid certain pitfalls that might break the chain and stop progress further down the line.
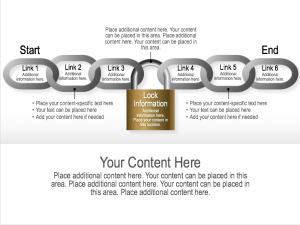
At times, your project may have expectations or barriers to later parts of the process. These obstacles can put a slow or a stop on a project and shouldn’t be overlooked! A lock can be a good representation for financial approvals, client sign-offs, project deadlines, or supply requirements. Once unlocked, any of the following links in the chain can be followed and their associated tasks completed.
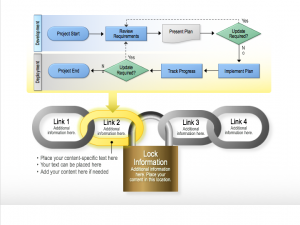
Probably one of the best things you can do in a process is drill down and get to the nitty gritty. The graphic pictured above is a fantastic example of mixing different chain graphics into one to get that desired and detailed effect. Take some of our flow or process charts and substitute in the parts that you need to best explain what each phase of your project will look like. Honestly, that’s the best thing about all of these PowerPoint graphics. Each graphic can be fully customized down to each of its smaller pieces to fit your needs for color, shape, number, and style.
Take a closer look at the Chain Graphics in our PowerPoint Graphics Library today!


Recent Comments