Making an intriguing, content filled presentation is tough, especially when dollar bills and hard deadlines are involved. But with these 10 most downloaded graphics, your job just got a whole lot easier. Let me introduce you to the 10 Best PowerPoint Graphics of all time from GetMyGraphics.
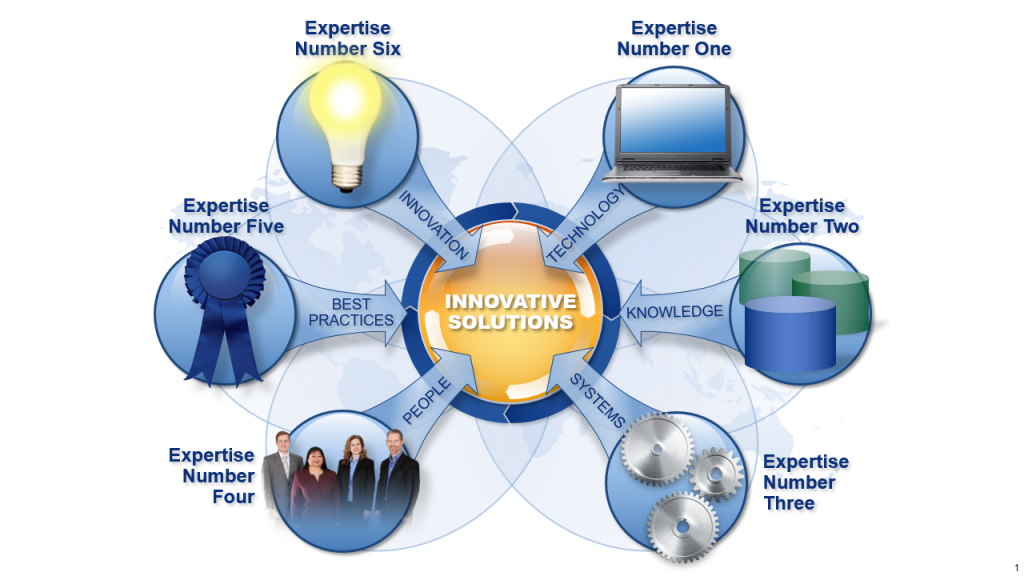
1. Animated Loop:
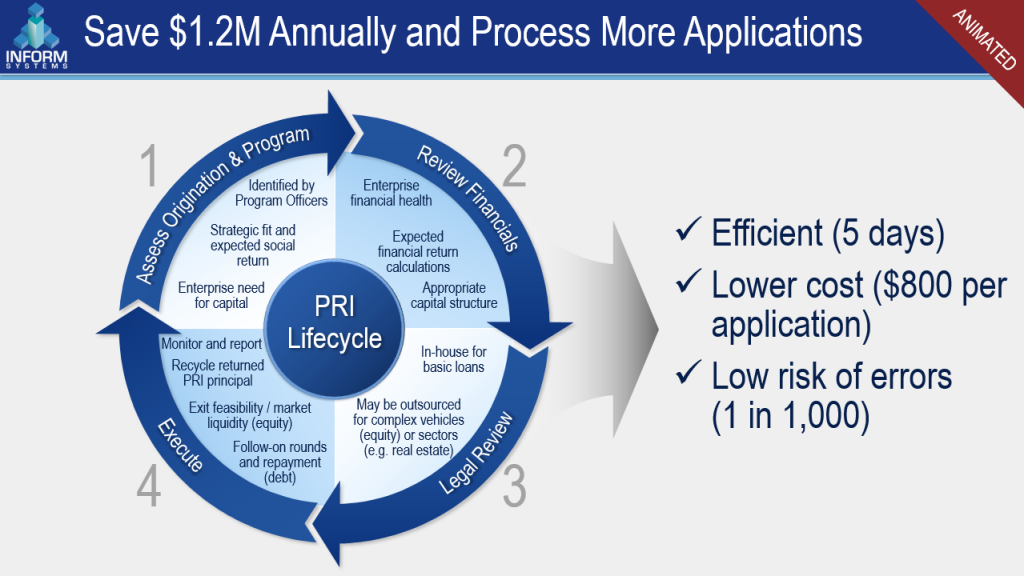
This is the most downloaded graphics template on GetMyGraphics. One of the major reasons is that it is animated, and it is a very versatile graphic. You can display many different kinds of information on this simple yet elegant animated loop.
2. Animated Timeline:
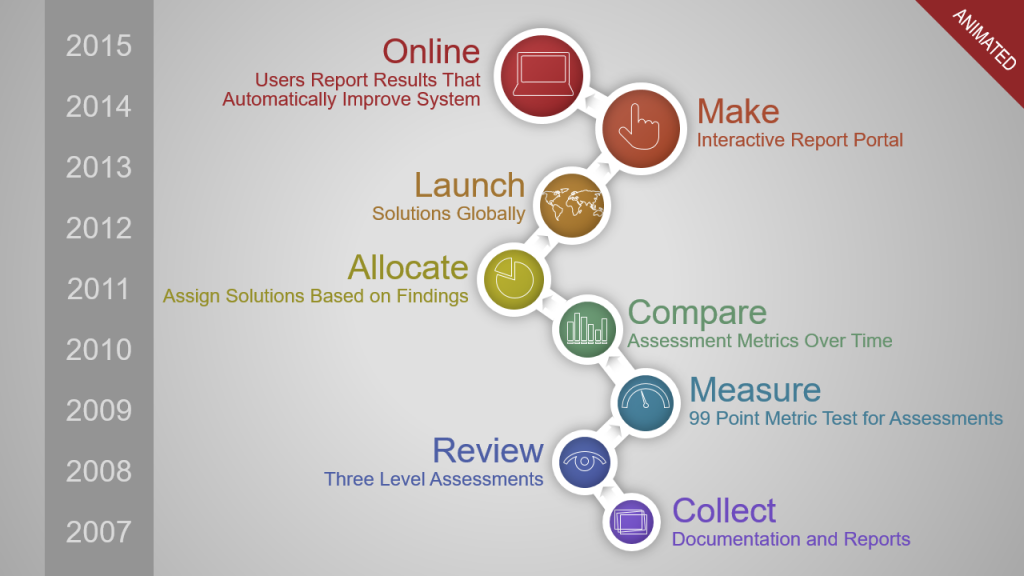
Using timelines in your projects, especially animated ones, is a very efficient way to display deadlines, major marking points, and high priority items without moving away from the main purpose of displaying the end goal. And after applying animations to it, it is no longer a boring conference room presentation!
3. Animated Funnel:
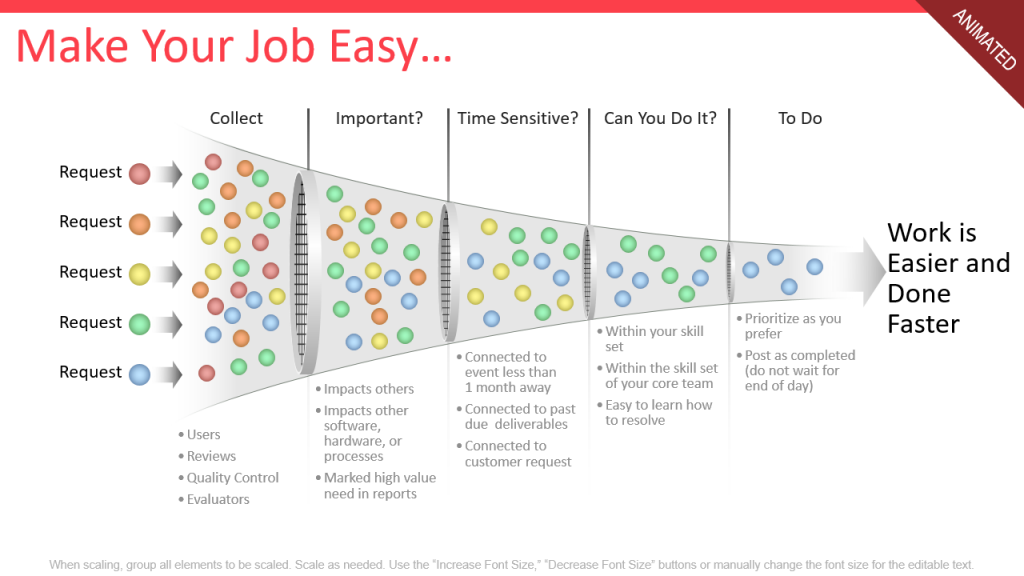
Funnels, like loop charts are versatile. The content that you can effectively display is very vast. Not only can you edit the color and shape of the particles shown, but you can change the animations that are applied to them. Thus allowing you to make a template your personal graphic design.
4. Gap Analysis:
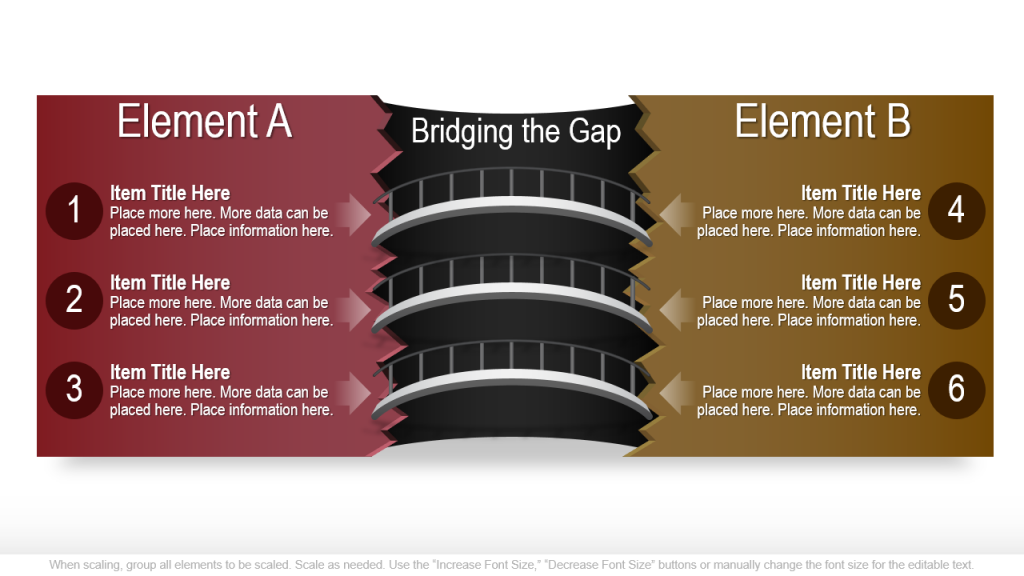
With this Gap Analysis graphic, you are able to easily show where you are as a company and where you want to end up. You can then simply address the process that you must go through to reach that goal. This template is consistent with the customizability that GetMyGraphics creates templates with. Feel free to change and morph colors, shapes, text, and style with all the tools given to you in PowerPoint.
5. Animated Bridge:
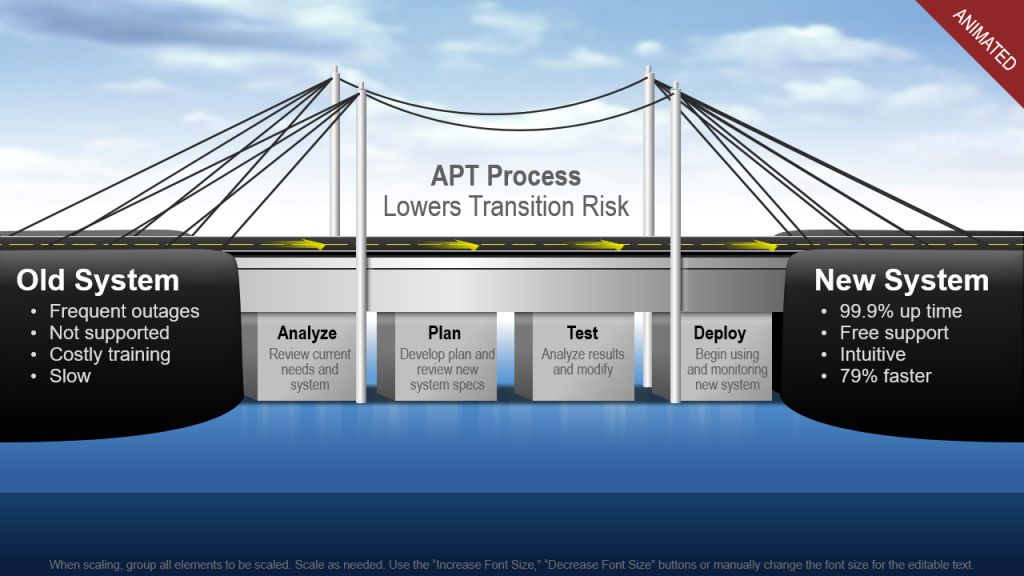
This animated bridge graphic allows and is built transitional training/presenting. This graphic is great for visually telling a story about how things are going to change and the steps that the audience will be required to take. Again, everything is built in PowerPoint and fully customizable.
6. Animated Funnel II:
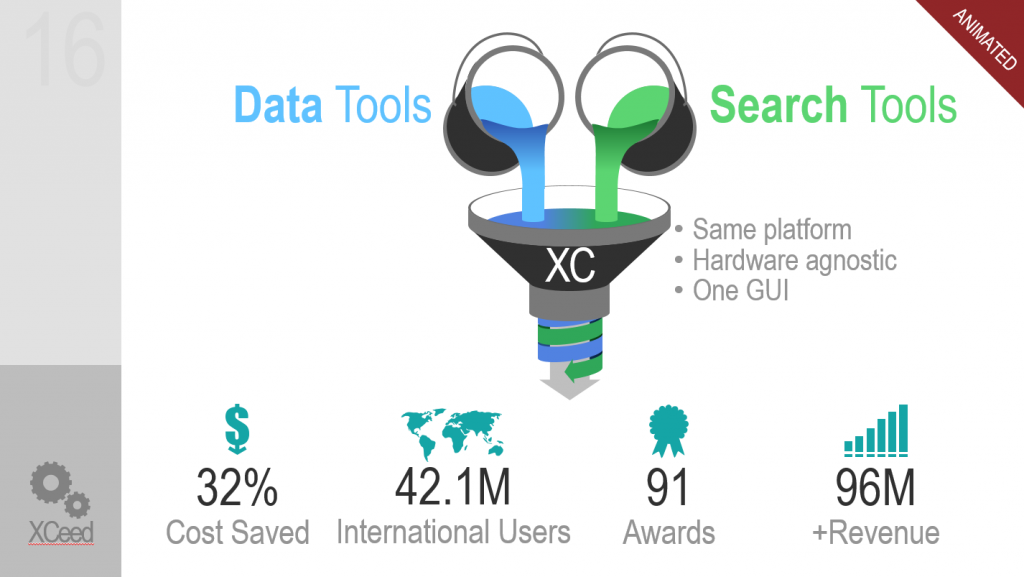
This animated funnel completes the same goal as the other featured funnel. This one takes it from a different perspective as it shows two paint cans being mixed together to create something else entirely. The colors and the end product are all customizable to meet your specifications.
7. Animated Timeline II:
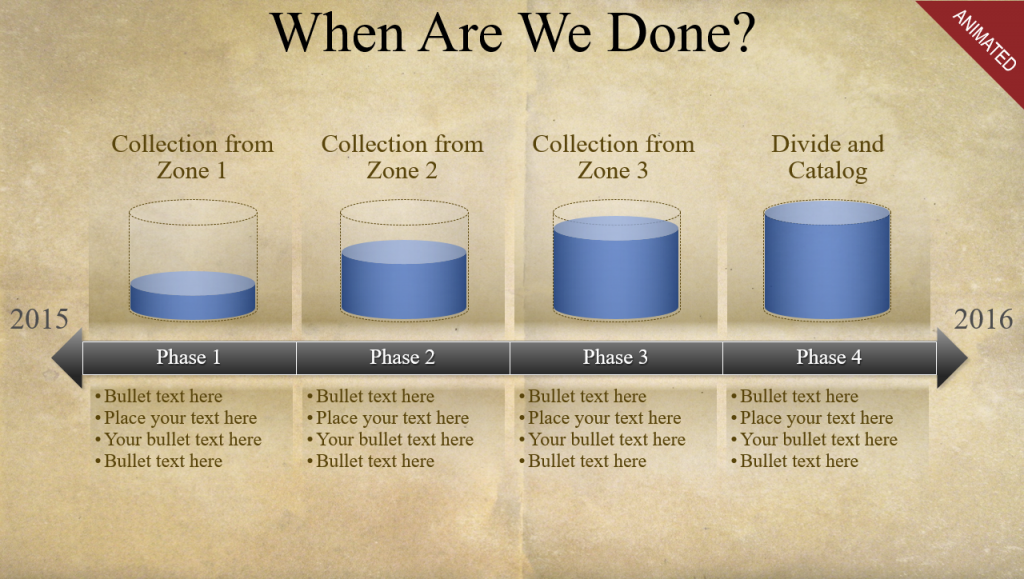
This timeline is a very good way to captivate an audience who really doesn’t want to be at a beginning of year goals presentation. As you scroll through this graphic, you will see the containers of fluid fill up in conjunction with the goals that will be completed.
8. Venn Diagram:
This Venn Diagram is perfect when you are wanting to start off or end your presentation with an overview of a specific subject. You get all the assets you see below and you have the freedom to skew, change and export everything.
9. Animated Point Graph:
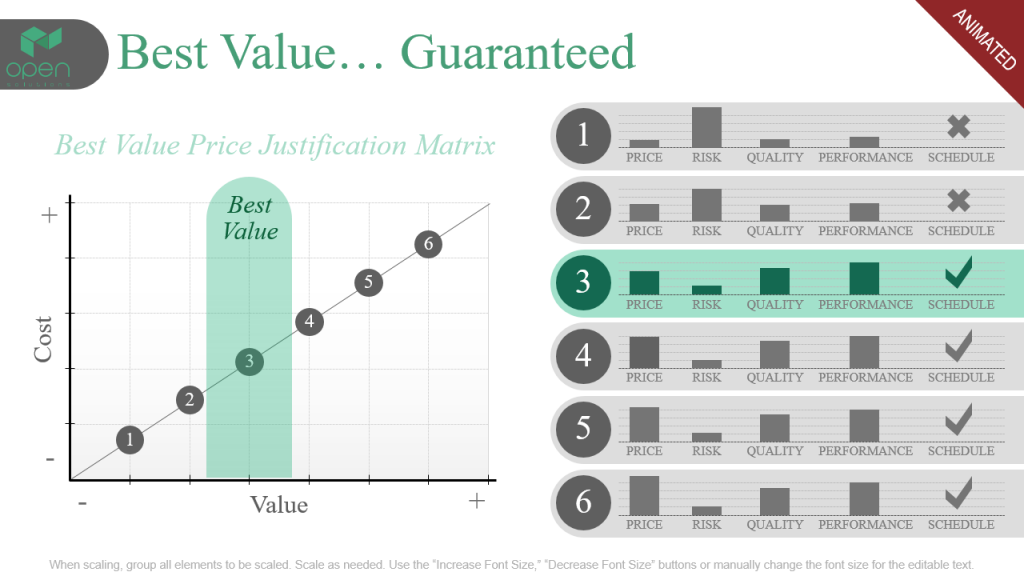
Because this graph is custom made in PowerPoint, you can edit every single part of it. This allows you to customize the graph and stats with greater freedom when compared to the built-in graphs and tables. You can add and change the animations and transitions of every asset in the graph and statistical table.
10. Animated Scale:
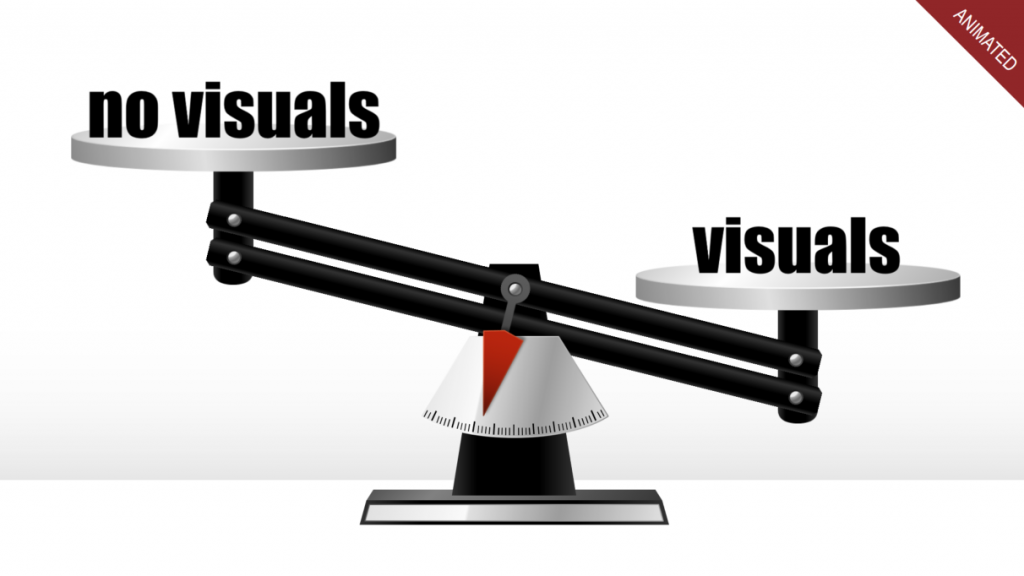
This graphic is a clever way to show to show pros and cons of a specific product or technique. You can easily insert bulleted lists that move up and down with the scale to show best practices and worst practices.
With all of these top downloaded graphics in your hands, the possibilities are endless (if you are creative enough)! If you wish to view the full GetMyGraphics Library, click here. If you really want these assets, and don’t have a subscription yet, sign up today! Do you think these assets will help you? Are there any assets you think we should include? Let me know in the comments section below!
Recent Comments