I surveyed educational professionals about their biggest challenges when including infographics in their learning materials. Know-how was typically their top answer. So to help my fellow educational professionals, I have compiled three tips that kickstart the infographic process.
1. Sketch and validate. Rendering a visual on a computer is too time-consuming and often requires training. Instead, make a rough sketch of your infographic first. You do not need to be Michelangelo to communicate your ideas with a basic drawing. Boxes, circles, stick figures, lines, arrows, and labels sufficiently communicate anything. Consider the concept that is communicated by this simple pen drawing.
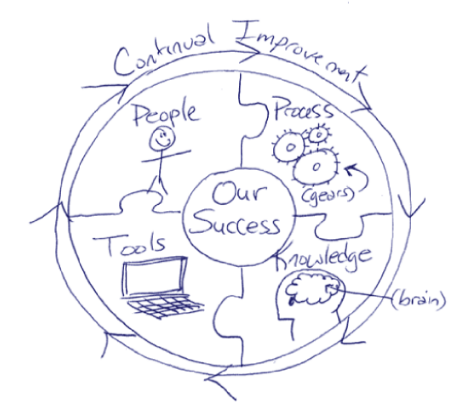
Ask a colleague to review your sketch. Then ask them to explain it to you. Did their explanation match what you intended your graphic to communicate? If not, make edits and ask again. Repeat this process until your reviewers agree that your graphic communicates the intended message(s). It is much easier (and takes far less time) to tweak or redraw a rough sketch than to do a final computer rendering for each change.
2. Avoid the “blank slide syndrome.” Start with an infographic that works and tailor it to meet your needs. I recommend creating a library of graphics commonly used in your organization’s learning materials. These graphics become your foundation for new projects. It’s much easier to start with an older, successful graphic and tailor it, than start with a blank piece of paper. If nothing else, your library of graphics will get you thinking graphically. You will be amazed by how fast ideas come when you flood your brain with visuals.
Another place to find graphics to leverage is the Internet. Use these resources to search through a library of business graphics for ideas:
- Graphic Cheat Sheet—Search through our graphic samples for inspiration.
- Google Images—Type in your concept in the search field to see how others have used visuals for similar concepts. A great source to find ideas for how to develop your graphic.
- iStockPhoto—Type in a concept and you’ll be given images that relate to your concept. You can download and purchase these images for immediate use.
- Visual Literacy Periodic Table—A great place to look for graphic ideas.
3. Give learners a reason to care. Most visuals are ignored because they fail to connect with the audience. How will sharing this information help them or answer a specific question they need answered? When looking at your infographic ask, “So what?” If your content can answer that question, you are on the right track. If you don’t know what they care about, you want to find out. Not knowing what your learners cares most about means wasted time and certain failure.
Apply these three tips to your training event and be more successful.
Mike Parkinson, Microsoft MVP and APMP Fellow, is a graphics and presentation guru, marketing expert, and professional educator. Fortune 500 and small companies, government agencies and educational institutions work with Mike to achieve their goals.
Contact him at mike@billiondollargraphics.com, 703-608-9568, or visit www.BillionDollarGraphics.com.
Great info and tips Mike!