63 years ago, James D. Watson and Frances H.C. Crick made a landmark discovery in the field of biology: the double-helix chemical structure of DNA. In the years since, that discovery has ushered in a brand new era of genetic science, bolstering the earlier discoveries of Gregor Mendel and Reginald Punnet and going far beyond. We now have the ability to create new life forms without breeding, simply by rewriting their genetic code, or even splicing in the code of another creature, creating everything from pesticide-resistant crops, to glow-in-the-dark monkeys. Though it’s applications are often controversial, the discovery of DNA is without a doubt a major scientific finding.
Decades later, we’d like to take a moment and show you our awesome DNA PowerPoint Graphics.
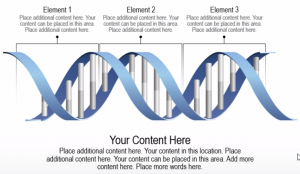
DNA graphics, such as the one above, are perfect for showing the building blocks of abstract concepts. For instance the above graphic could represent the the DNA of your company, with each bracketed section labeled as a different aspect of your companies personality and culture. Element 1 could be labeled “Time Management,” Element 2 could be “Charitable,” and so on. If that’s not specific enough, you might even consider labeling the “rungs” on the DNA ladder with subtopics that fall under the larger attribute. Under the “Time Management” bracket, you could label the rungs “punctuality,” “consideration,” “efficiency,” etc.
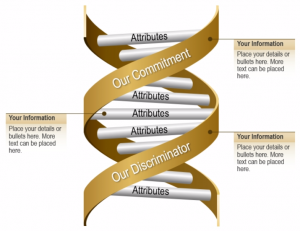
This second example takes the work out of labeling the rungs. The emphasis here is placed more on the rungs themselves than on a collection of rungs together. You’re also supplied with text boxes to further explain the attributes that don’t explain themselves.
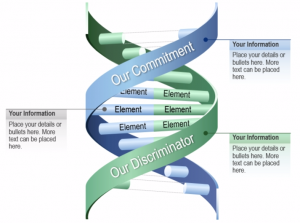
Finally we have this graphic, which at first glance looks very similar to the last one, but with one important difference. If you’ll notice, the top and bottom of the DNA strand are “unzipped,” both implying that this DNA is being taken apart or being put together and that the strand is composed of 2 different strands. This is a great way to demonstrate mergers. With two elements on each rung of the ladder, you have the opportunity to compare similar or corresponding attributes of two organizations or concepts.
As always, each of these graphics are completely customizable, down to the individual shapes and text elements. You may not have the means to tamper with your own DNA, but have fun playing with ours!
Find these and other DNA graphics in our PowerPoint graphic library!
Recent Comments