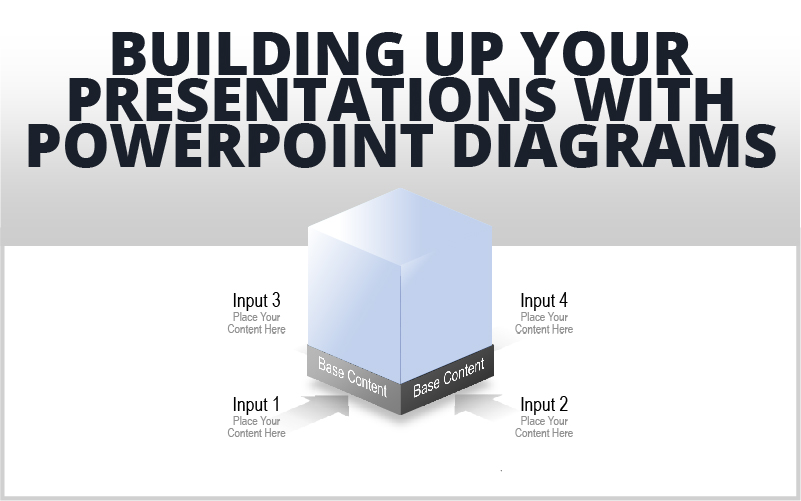
“Building blocks” is a common term used to describe something relatively small that groups together to create something bigger and more complex. For example, “atoms are the building blocks of matter,” or “cells are the building blocks of living things,” etc.
With our collection of block-related PowerPoint graphics, you can build yourself an excellent presentation to describe any number of complex systems.
Block Graphic Packs

First and foremost, we offer packs of simple block graphics in various shapes, sizes, and colors. It’s a great way to get a bunch of different blocks to mix and match and play with. There is also a row of blocks in each one with opened flaps at the top to look like an empty box ready to be packed up. You can put other objects and graphics inside these boxes to illustrate a sorting process (such as a baseball going into a box labeled “sports equipment”).
Pyramid
Pyramid graphics are handy for explaining chains of command and other hierarchical structures. They very plainly show a small number of blocks at the top, branching out to many blocks at the base layer. One application of these PowerPoint diagrams might be an explanation of the feudal system, showing kings at the top layer, working its way down through lords and noblemen all the way to serfs at the bottom of the heap. With a few clicks, you can modify this graphic to make it fit the structure you wish to illustrate, and quickly create a poignant analogy.
Zooming and Simplifying
The above graphic has multiple applications, one of which is simplification. Notice that the first cube is a big Rubix cube-like shape, comprised of 64 smaller cubes, while the second cube only has 8 pieces, and the third cube has 1. No division, no moving parts, just one clean block. With this in mind, we can fill the text with pertinent information, starting from the most complex system and simplifying to the simplest possible version. You might also use this graphic to break down a complex system layer by layer to get to it’s core building block. Using a biology example, we might consider cube 1 to be an organ. Zooming in to cube 2, we see that organs are actually comprised of various types of tissues, before zooming in further to realize that tissues are made of cells, the building block of life.
Projections
It’s great to have current data, because that shows things as they are at the moment and in the past, allowing one to identify trends and patterns so we know what works and what doesn’t work in future endeavors. It’s also important to set goals and make the calculations necessary to reasonably guess what can be expected in the future. The above graphic allows the user to illustrate the data as it currently stands with a set of solid of blocks, and map out probable outcomes of the next three iterations.
You can find these and other excellent PowerPoint diagrams in our PowerPoint graphics library. Download today!


Recent Comments