Brilliant thinkers and orators use this technique to tout their ideas. Scientists instinctively do it when explaining theories to laypeople. Well-liked public figures are notorious for employing this method to generate support for their organizations and businesses.
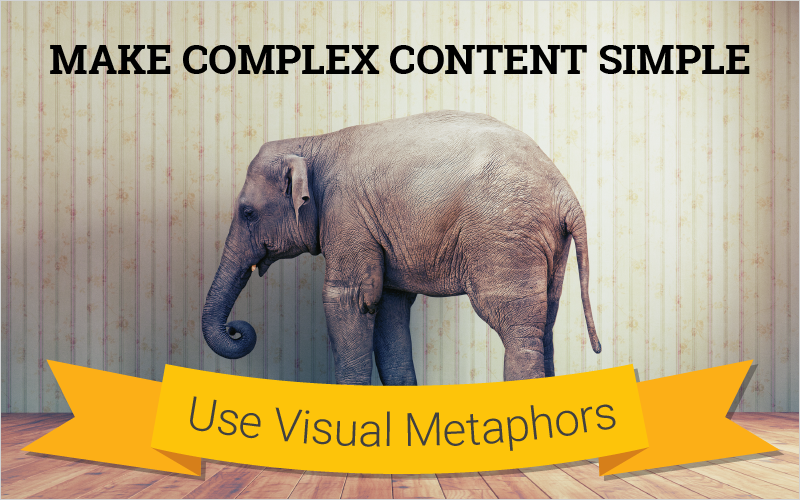
What is their secret? Use visual metaphors to make powerful infographics. Visual metaphors can help communicate information that may otherwise be more confusing or time-consuming to share as is. Imagine you are teaching a new software tool to an audience that knows what they want but is unclear how the new tool will work for them. In their job, they need actionable intelligence based on specific queries entered into a database. The new tool meets their core need and also gathers large volumes of information and automatically eliminates data that isn’t relevant to their queries through a series of algorithms. In the end, all relevant data is presented in an intuitive graphics user interface that makes their process more efficient. (Potentially confusing isn’t it?)
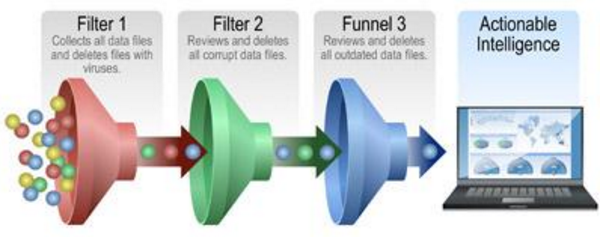
How might you show this software tool using a metaphor? How will the metaphor reinforce the coded process that occurs to ensure only the best information is funneled to the end user? The visual metaphor is often found in how you describe the process to others. If the data is condensed, show the information sifting through a funnel. A funnel is a great visual metaphor for this topic. The following funnel graphic simplifies the process of the new software tool, while highlighting its key functions.
Using a visual metaphor infographic is a unique way to communicate any complex concept. It’s easy to do. Think about how you would describe your solution, idea, or process and look for keywords that point toward the correct visual metaphor. List the attributes of your subject matter and find an object that has similar characteristics. Do you want to show how the learner is on the road to success if they follow a certain path? Use a road graphic.
The possibilities are endless and will make your educational materials more memorable and more likely to be adopted.
Mike Parkinson, Microsoft MVP and APMP Fellow, is a graphics and presentation guru, marketing expert, and professional educator. Fortune 500 and small companies, government agencies and educational institutions work with Mike to achieve their goals.
Contact him at mike@billiondollargraphics.com, 703-608-9568, or visit www.BillionDollarGraphics.com.
Recent Comments