by Thomas Reyes-Cairo | PowerPoint Graphics
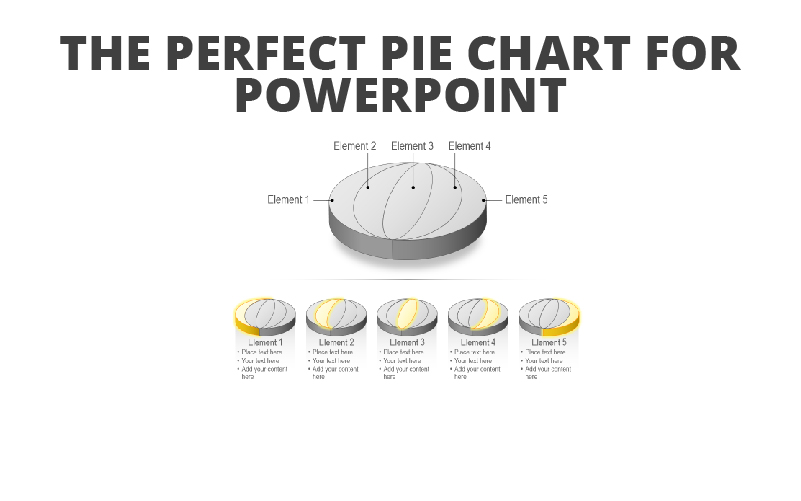
Apple 42%. Cherry 18%. Pumpkin 30%. Pizza? 100%, if you ask me. Pie charts are a common way to show how statistical data is broken up into individual parts, and they are a PowerPoint staple. When you want to talk …

by Thomas Reyes-Cairo | Cutout People Images
A good way to spruce up a PowerPoint presentation is to add a narrative structure. A common mistake of beginning presenters is to forget structure completely and just rattle off a bunch of information, regardless of flow, timing, or …

by Thomas Reyes-Cairo | PowerPoint Tips
No one sits down for a presentation thinking, “Man, I really hope this bores me to tears!” Though we don’t always want to admit it, we want to be entertained. We want to see and experience something that pushes our …

by Thomas Reyes-Cairo | PowerPoint Graphics
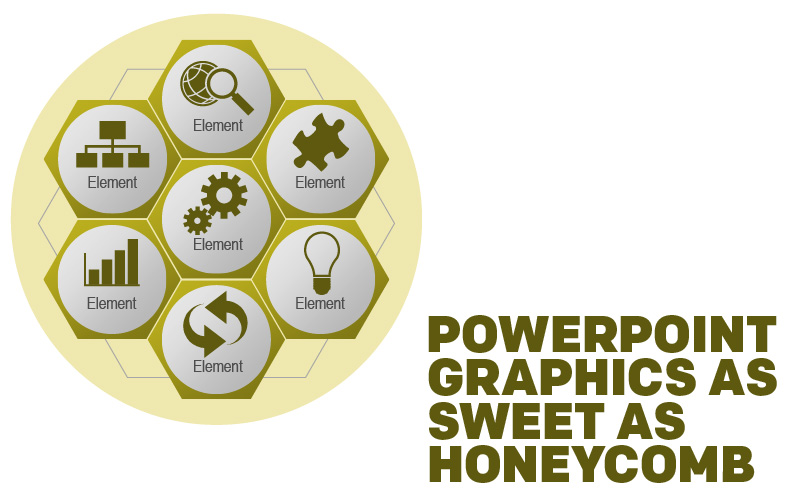
Bees. Although they are disciplined and hierarchical, there is still something quite whimsical about those little creatures. Buzzing like a helicopter from flower to flower, spreading pollen to enrich the local flora, and creating that sweet, syrupy nectar we know...


Recent Comments