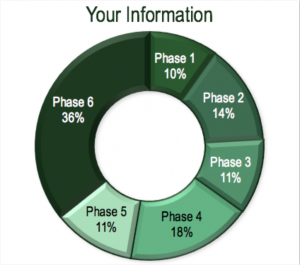
Apple 42%. Cherry 18%. Pumpkin 30%. Pizza? 100%, if you ask me. Pie charts are a common way to show how statistical data is broken up into individual parts, and they are a PowerPoint staple. When you want to talk percentages, pie charts are an effective way to give a recognizable visual representation of information. Let’s take a look at some of the pie charts and graphics available in our PowerPoint Graphics Library.
Click on the image to view this graphic in the library!
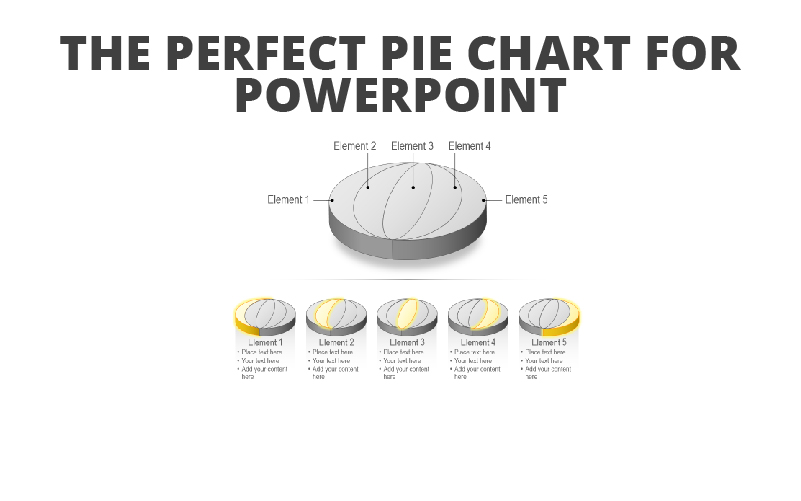
This first graphic is built as an actual chart, formatted for a particular look and feel. One of the great parts about it is that you can easily go in and change the data points using Excel. The chart will dynamically change the size of each section, even if your raw data isn’t based on percentages. Change the titles and colors to help create a more customized and easy-to-understand graph.
Click on the image to view this graphic in the library!
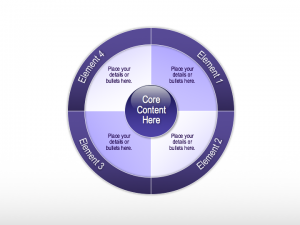
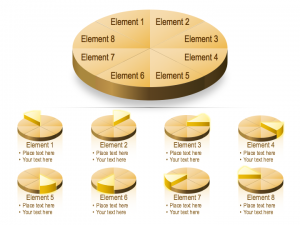
Pie charts can move beyond just simply showing data into the realm of explaining processes. When each slice of the pie comes together, you’ve fully completed the process! This is a great way to show how each step in the process holds equal value to the others and should be given a shared importance throughout.
Click on the image to view this graphic in the library!
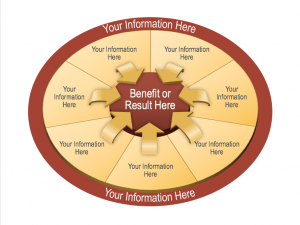
You can even use a pie chart to show how each division of the chart comes together into one greater whole benefit or result. For instance, when working on a project, multiple departments or individuals will come together—at varying degrees of participation or effort—to create a finished product. These charts can go further than expected percentages by adding the why or how each result is attained.
Click on the image to view this graphic in the library!
The biggest—and easily the most important—part of the pie is that it is completely editable. Change colors and, yes, shapes, to better match the data (and the conclusions of the data) you’re trying to demonstrate. Start a free 7-day trial and see how these pie chart for PowerPoint graphics will make creating your presentations as easy as pie!
Recent Comments