by Thomas Reyes-Cairo | PowerPoint Graphics
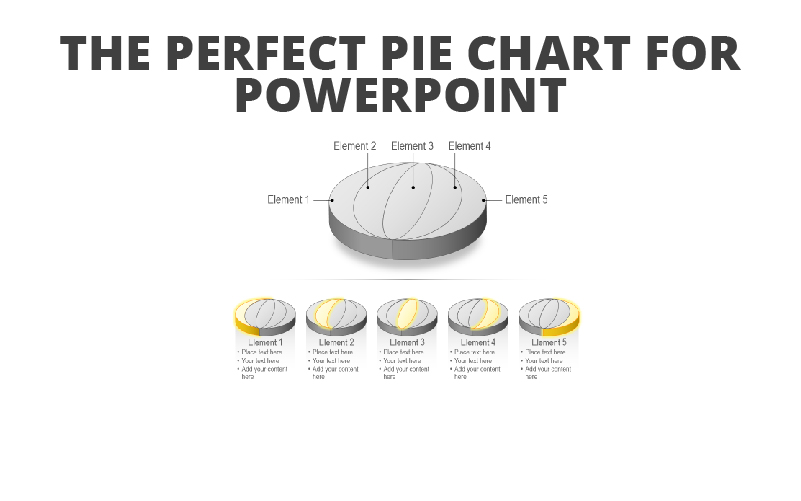
Apple 42%. Cherry 18%. Pumpkin 30%. Pizza? 100%, if you ask me. Pie charts are a common way to show how statistical data is broken up into individual parts, and they are a PowerPoint staple. When you want to talk …

by Thomas Reyes-Cairo | PowerPoint Graphics
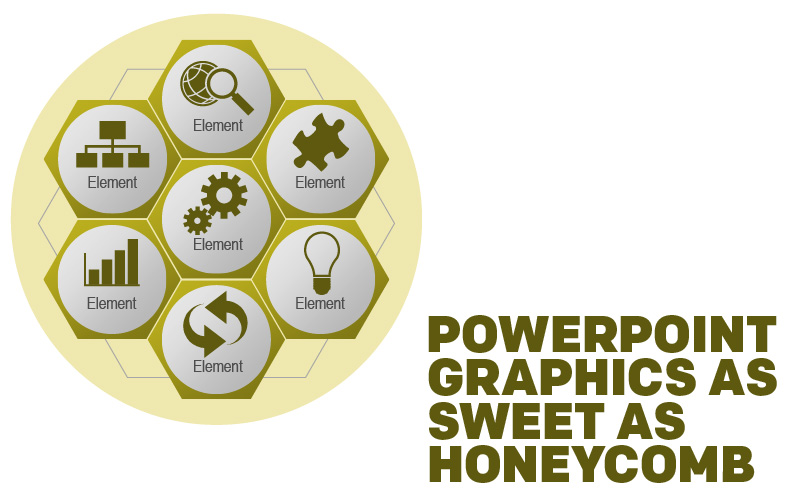
Bees. Although they are disciplined and hierarchical, there is still something quite whimsical about those little creatures. Buzzing like a helicopter from flower to flower, spreading pollen to enrich the local flora, and creating that sweet, syrupy nectar we know...

by Thomas Reyes-Cairo | PowerPoint Graphics
Funnels are one of the most useful tools in both the kitchen and the garage. Elegantly simple, they utilize a cone shape to more easily channel fluids and granular substances into small openings. They consolidate something that might otherwise be …

by Thomas Reyes-Cairo | PowerPoint Graphics
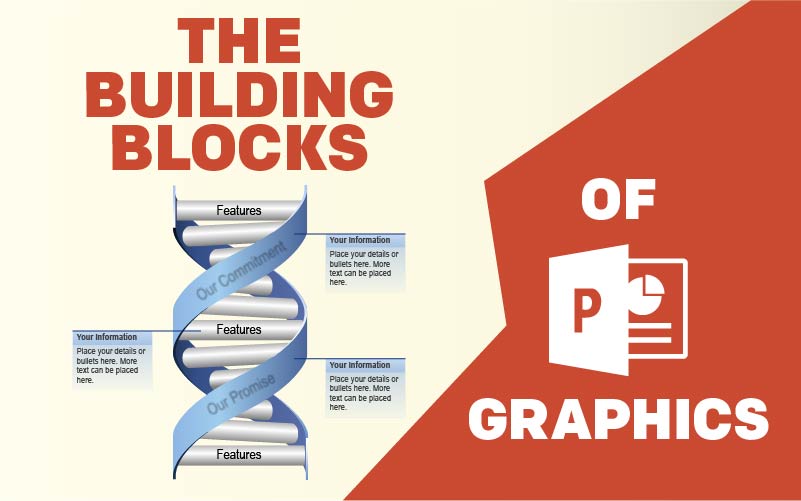
63 years ago, James D. Watson and Frances H.C. Crick made a landmark discovery in the field of biology: the double-helix chemical structure of DNA. In the years since, that discovery has ushered in a brand new era of genetic …

by Thomas Reyes-Cairo | PowerPoint Graphics, PowerPoint Tips, Stock Images
PowerPoint presentations are the most common and effective way to deliver pitches and detailed information to groups of people. This Microsoft product has become the established way that business people all around the world display and share information effectively....

by Thomas Reyes-Cairo | PowerPoint Graphics
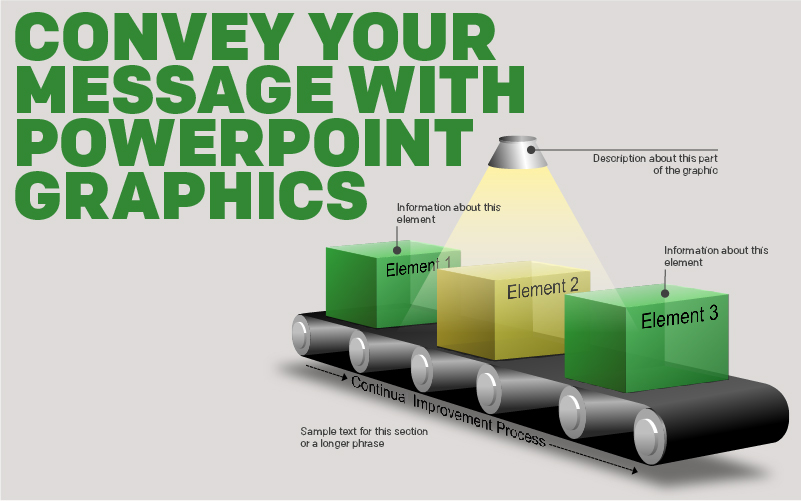
A conveyor belt is a representation of the great industrial period in which we live. Each item takes its time as it goes down the belt and meets an important building step in the process. Eventually, it is manufactured into …


Recent Comments