When you are churning out several presentations (and/or marketing materials) in a year—or especially in a month—it is easy to get frustrated trying to find new concepts, new ways to show your ideas. Starting with a blank slide or page will not motivate you. You need to refocus and get inspired.
I used to flip through graphic design books to find interesting ways to show information. Now the Internet has made it easier to find inspiration. In Google, I type in my concepts or keywords and click on the Images tab to see what others have done. (Great artists steal as Picasso once said.) I check stock image sites and browse through their collections. At Get My Graphic, we encourage our users to enter keywords into our Advanced Search field to find a variety of images and graphic metaphors to communicate ideas in new ways and add visual interest to presentations.
Inputting the proper keywords is essential to find the most concise range of images. Brainstorm with your team to come up with keywords related to your concepts and use that list when searching for graphics.
For inspiration, I’ve included a few of Get My Graphic’s latest visual metaphors below. These graphics are fully editable in PowerPoint 2007 or higher. You can change colors, elements, and text to fit your concepts, themes, and style guides. I included keywords that you can use to find these graphics and many others. Play around and learn new ways to show the same old information, and quickly fill up that blank page. Give your audience different ways to view your ideas—and remember them.
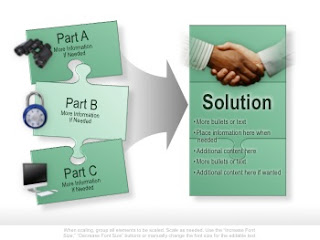
Puzzle Graphics
Use a puzzle to show parts of your organization, process, or business plan coming together to work in harmony toward a solution. This graphic can depict your company partnering with another contractor. The icons can represent an oversight committee (binoculars), security team (lock), web programmers (computer), or whatever concepts work for your information.
Keywords: cooperation, synergy, teamwork, unify, interact, process

Pie Graphics (Segmented Chart)
Use this pie chart to group segments of your concept: highlight steps in a process, breakout corporate departments, focus on individual leadership roles, etc. Switch out the icons or use the included icons to indicate remote communications (tablet), information (book), observation (binoculars), or anything else you can relate to these images.
Keywords: group, allocation, division, arrange, organize, categorize

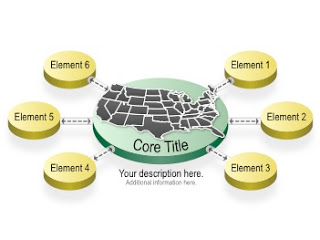
Process Graphic
Use this process graphic to show information being stored in countrywide databases, production plants influencing the country’s economy, sales teams communicating with clients in the United States, and many other concepts about parts flowing into and from a core element.
Keywords: global, flow chart, communication, interaction, influence
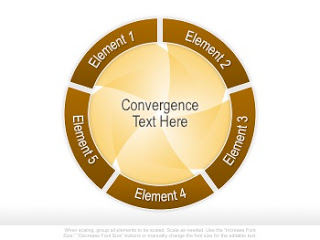
Venn Diagrams
Use this Venn diagram to show a convergence of elements such as departments forming a university, parts producing a product, job skills making up the perfect candidate, or components that merge together to create an even better component.
Keywords: convergence, cooperation, synthesis, unite, bring together
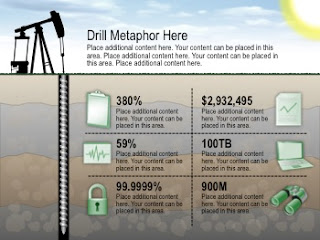
Cross Section Diagrams
Use this graphic type as a metaphor for digging deeper into your company’s issues, drilling for funding, excavating corporate resources, mining for information, or any concept that requires extensive research or investigation. The icons can represent floor managers (clipboard), accounting (line chart), sales activity (monitor line), web traffic (laptop), security (lock), analysis team (binoculars), etc.
Keywords: research, hierarchy, analyze, mining, excavate, phases, process
Recent Comments