To put together a top notch presentation, you need to pull in top notch assets. It is hard to create awesome presentation graphics with mediocre charts, stock images, infographics, and so on. GetMyGraphics has all three of these types of assets, and believe me when I say that they are high end. I will show you a variety of graphics, charts, and some assets from our Cutout People Library that will get you excited about creating the most incredible presentation with them. After that, I will show you how easy it is to edit our assets to fit your style, brand, and creativeness!
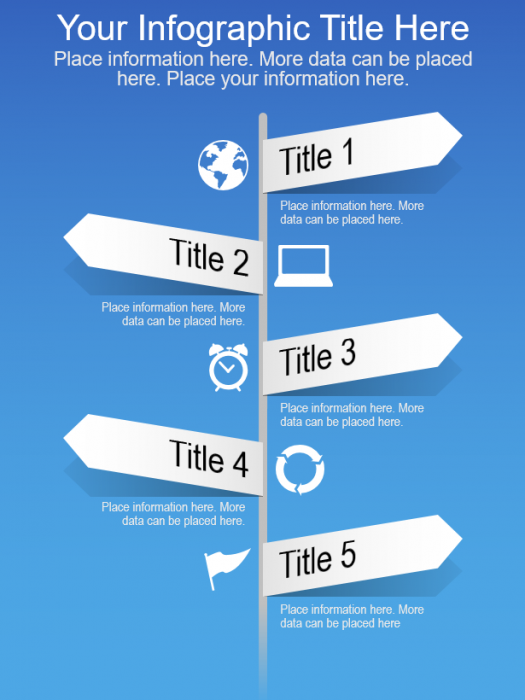
Infographics:
Using infographics in your presentations (especially animated ones) can take your presentation from a 7 to a 10 in no time. Not only do infographics look amazing, they are packed full of valuable content. Be careful to not use too many infographics in your presentation. Yes, they are a relieving change of view from the normal slide layout, but using too many can be an eyesore, and you will lose the attention of your audience.
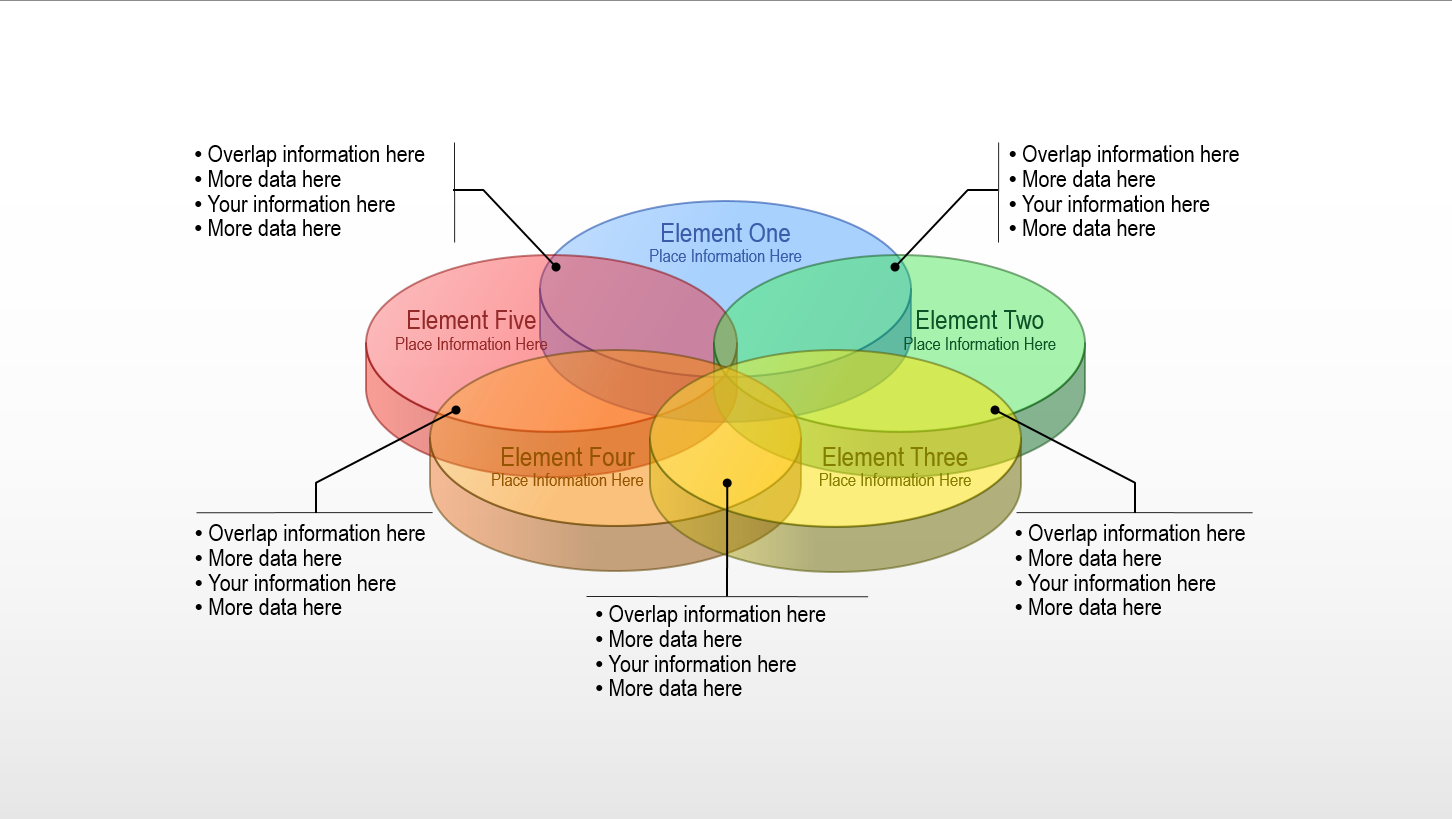
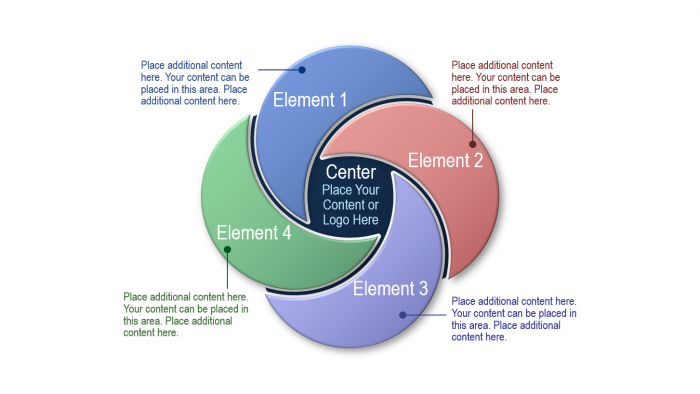
Venn Diagrams:
Venn diagrams are the best way to show synergy. When you need to demonstrate how well two ideas interact and mesh, Venn Diagrams do it better than anything else. In most presentations, you are trying to get people to accept an idea or practice. By placing the information strategically in a Venn Diagram, you will simply yet beautifully convey your message. And by adding icons from our Stock Images Library you can call out the information even further so that the audience will instantly see your point.
Cutout People:
When it comes to satellite presentations, and some live presentations, you need to create a connection between you and the audience. Without that connection your audience may act as if no one is watching and that they can doze off and not pay attention. With our massive and diverse Cutout People Library of over 50,000 images you have everything you need for every situation. Whether your industry be medical, industrial, or business, we’ve got you more than covered.

How to Edit:
Editing only really occurs when you download a graphic or chart from our library. There is no editing necessary when you download a cutout person or a stock image. I will go through step by step and demonstrate how to edit an infographic (These steps will apply to all graphics and charts).
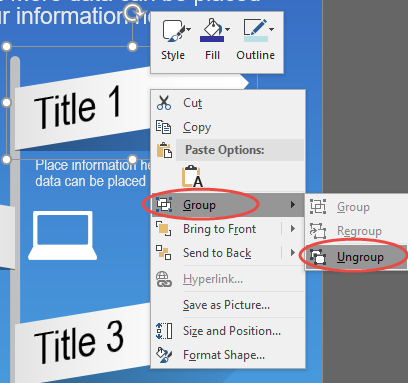
Step 1:
Once you have jumped into PowerPoint with the graphic of your choice (in this instance it will be an infographic), the first step is to ungroup the images that you want to edit. For example, to the naked eye, an asset can have multiple pieces that make it look good. Lots of assets might have shadows and multiple objects grouped together giving the graphic a clean and professional look. You may have to ungroup multiple times to be able to select the one piece that you want to change. To ungroup an object, right-click and select Group, then Ungroup.
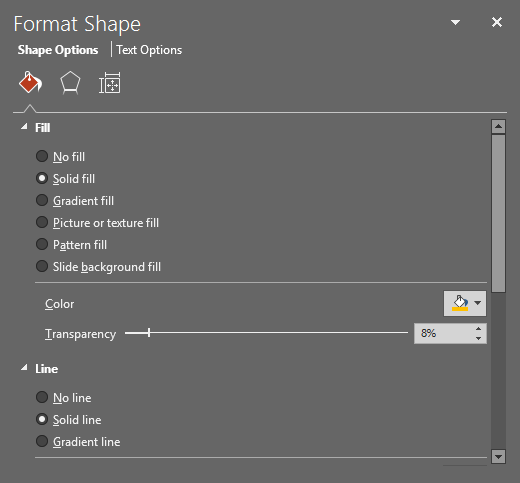
Step 2:
The next step is to simply change the colors of the assets as well as the background color. That is simply done by right clicking on the asset (after ungrouping), and selecting Format Shape. Here you can change everything that has to do with the look and feel of the object. Depending on how much time you want to spend, you can completely overhaul anything you download!
Step 2.5:
This last step isn’t really a full step because it is so simple. The last half of a step is to replace all the filler default text with your own content. And then you’re done! See, it wasn’t that hard was it?
It only takes 2.5 steps to brand our graphics to your company or needs. Of course, you can add animations, transitions, and a whole lot more depending on your skill level. Let me know in the comments if there is something specific you would like to see covered in a blog, or a webinar!
Recent Comments